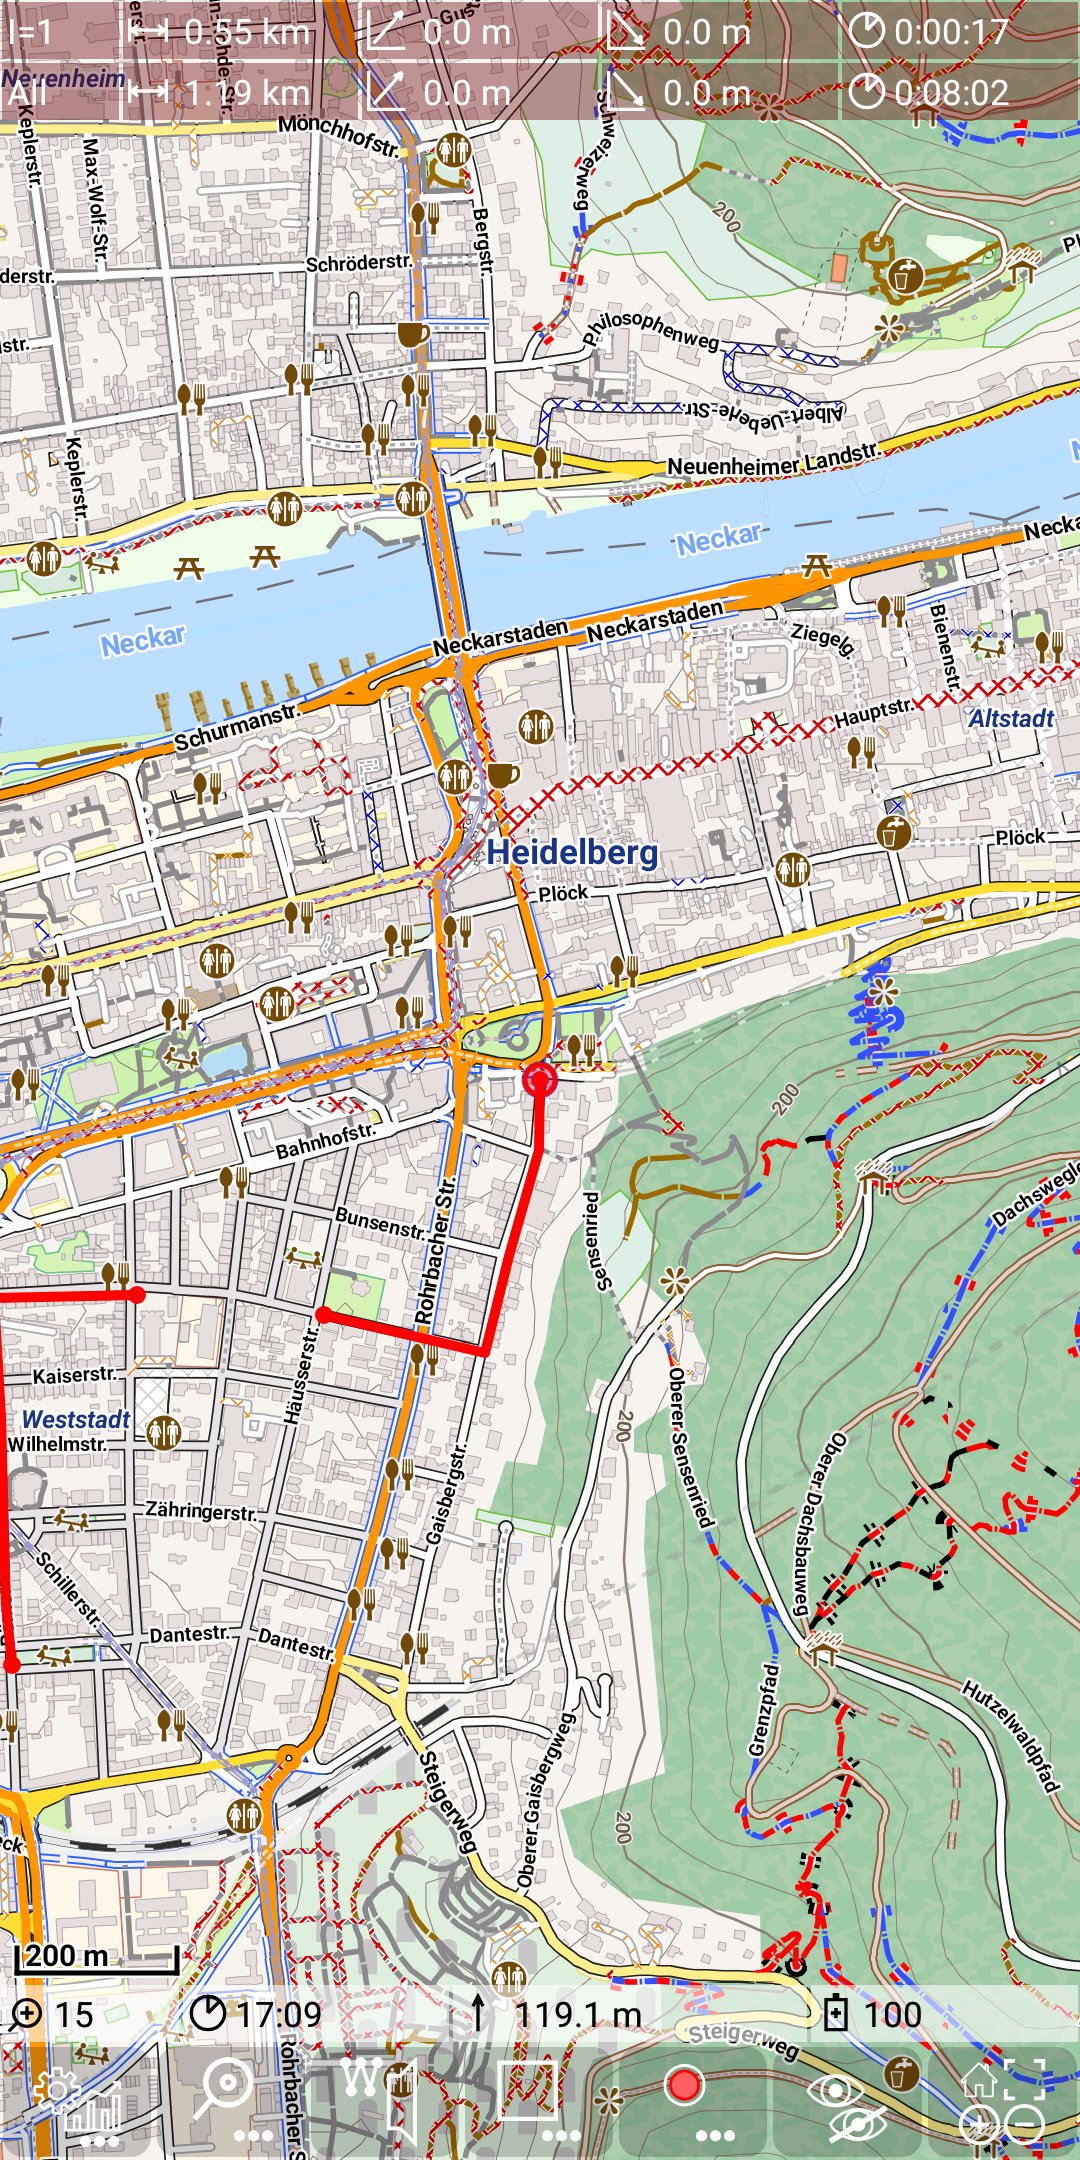
Main Track Feature: dashboard
The following snapshot shows one selected track.
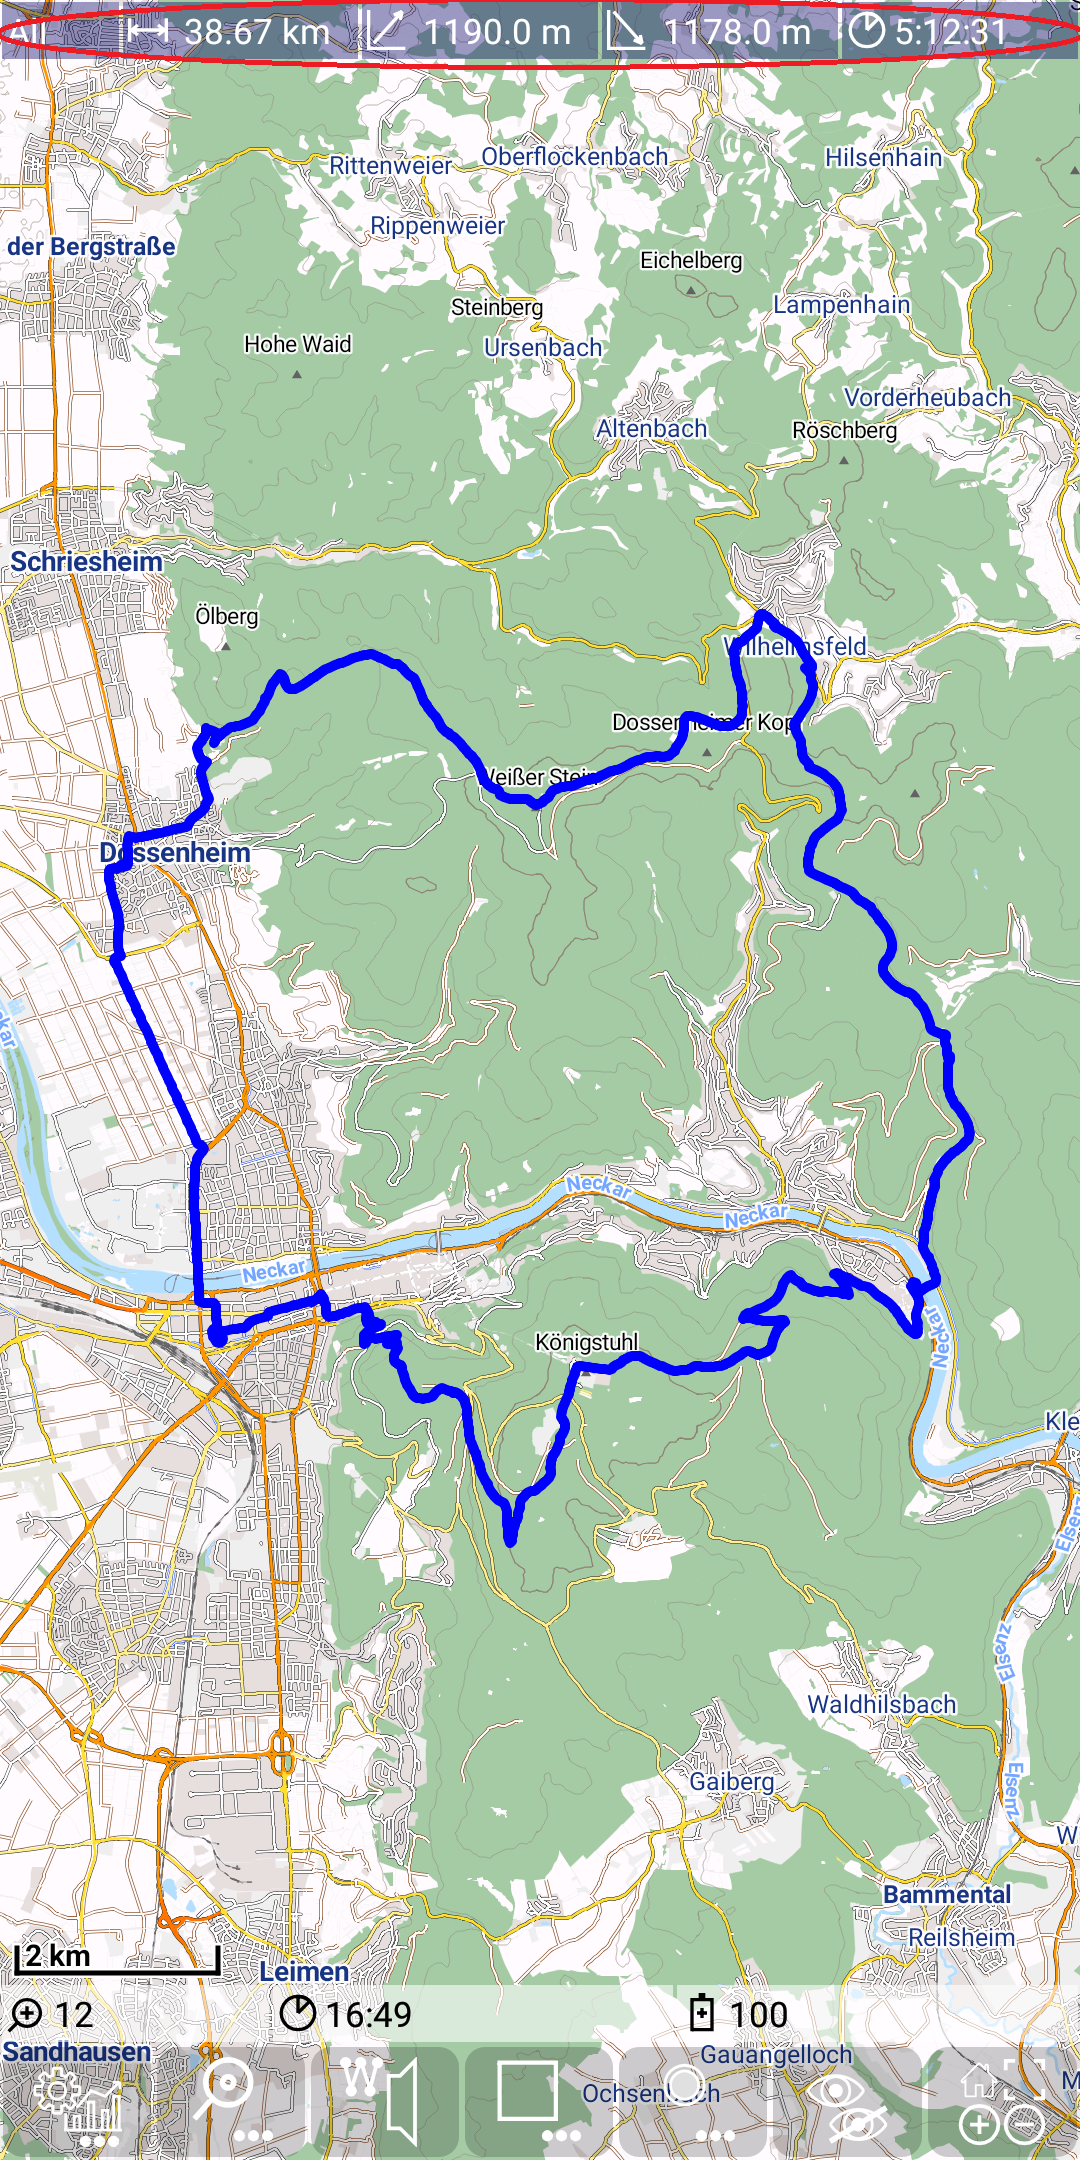
Now we want to focus on the dashboard entry. Each dashboard entry contains five values:
- Segment indicator:
- All: covers the whole track,
- I=<nn>: indicates, that the statistic covers the segment with index nn
- Distance: the overall length of the track (segment)
- Height gain: the height gain of the track (segment)
- Height loss: the height loss of the track (segment)
- Duration: the duration of the track (segment)
All dashboard entries have the same structure. They are colored depending on their type:
- red: statistic of recording track
- blue: statistic of selected track
- purple: statistic of a route
So next figures show some more examples of these dashboard entries:
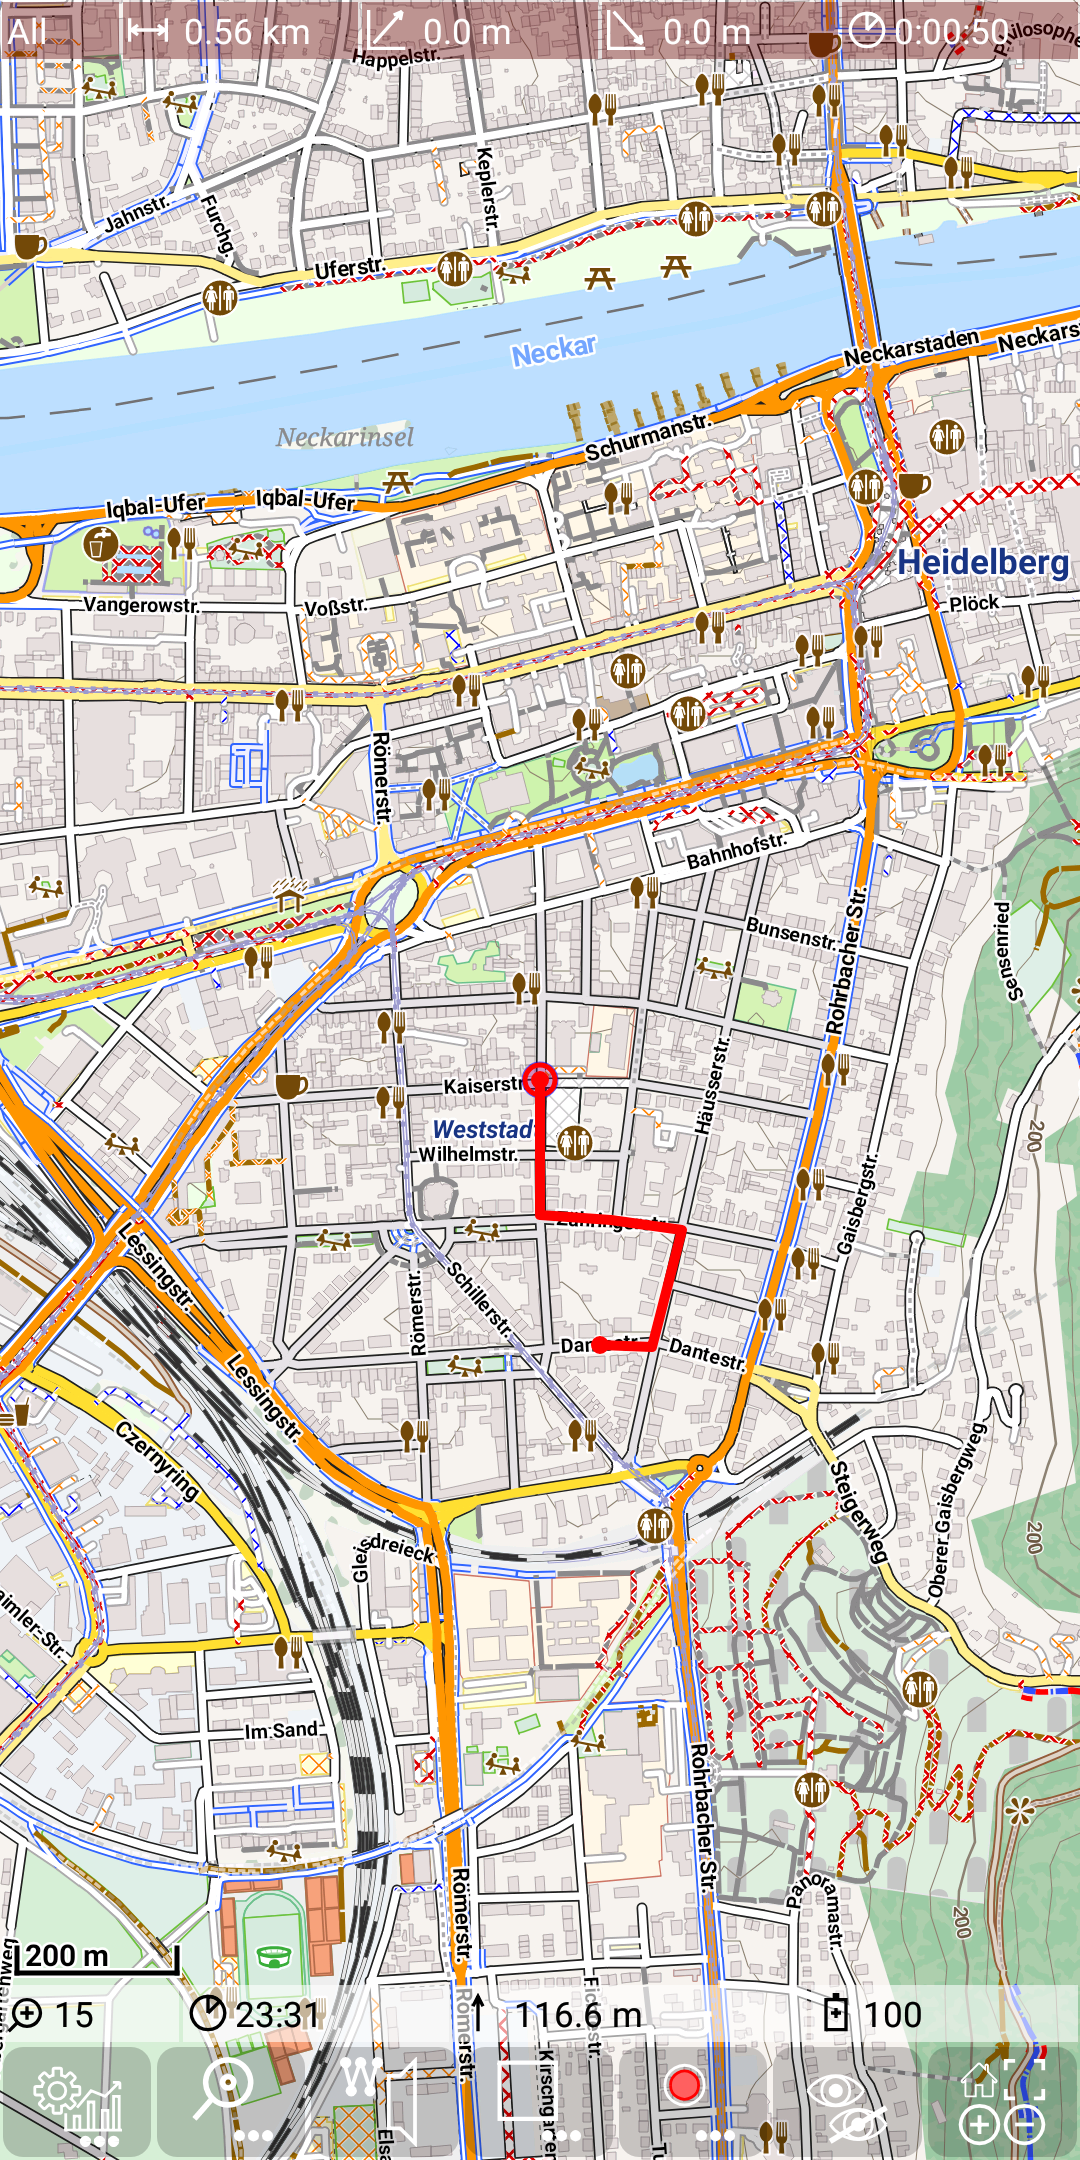
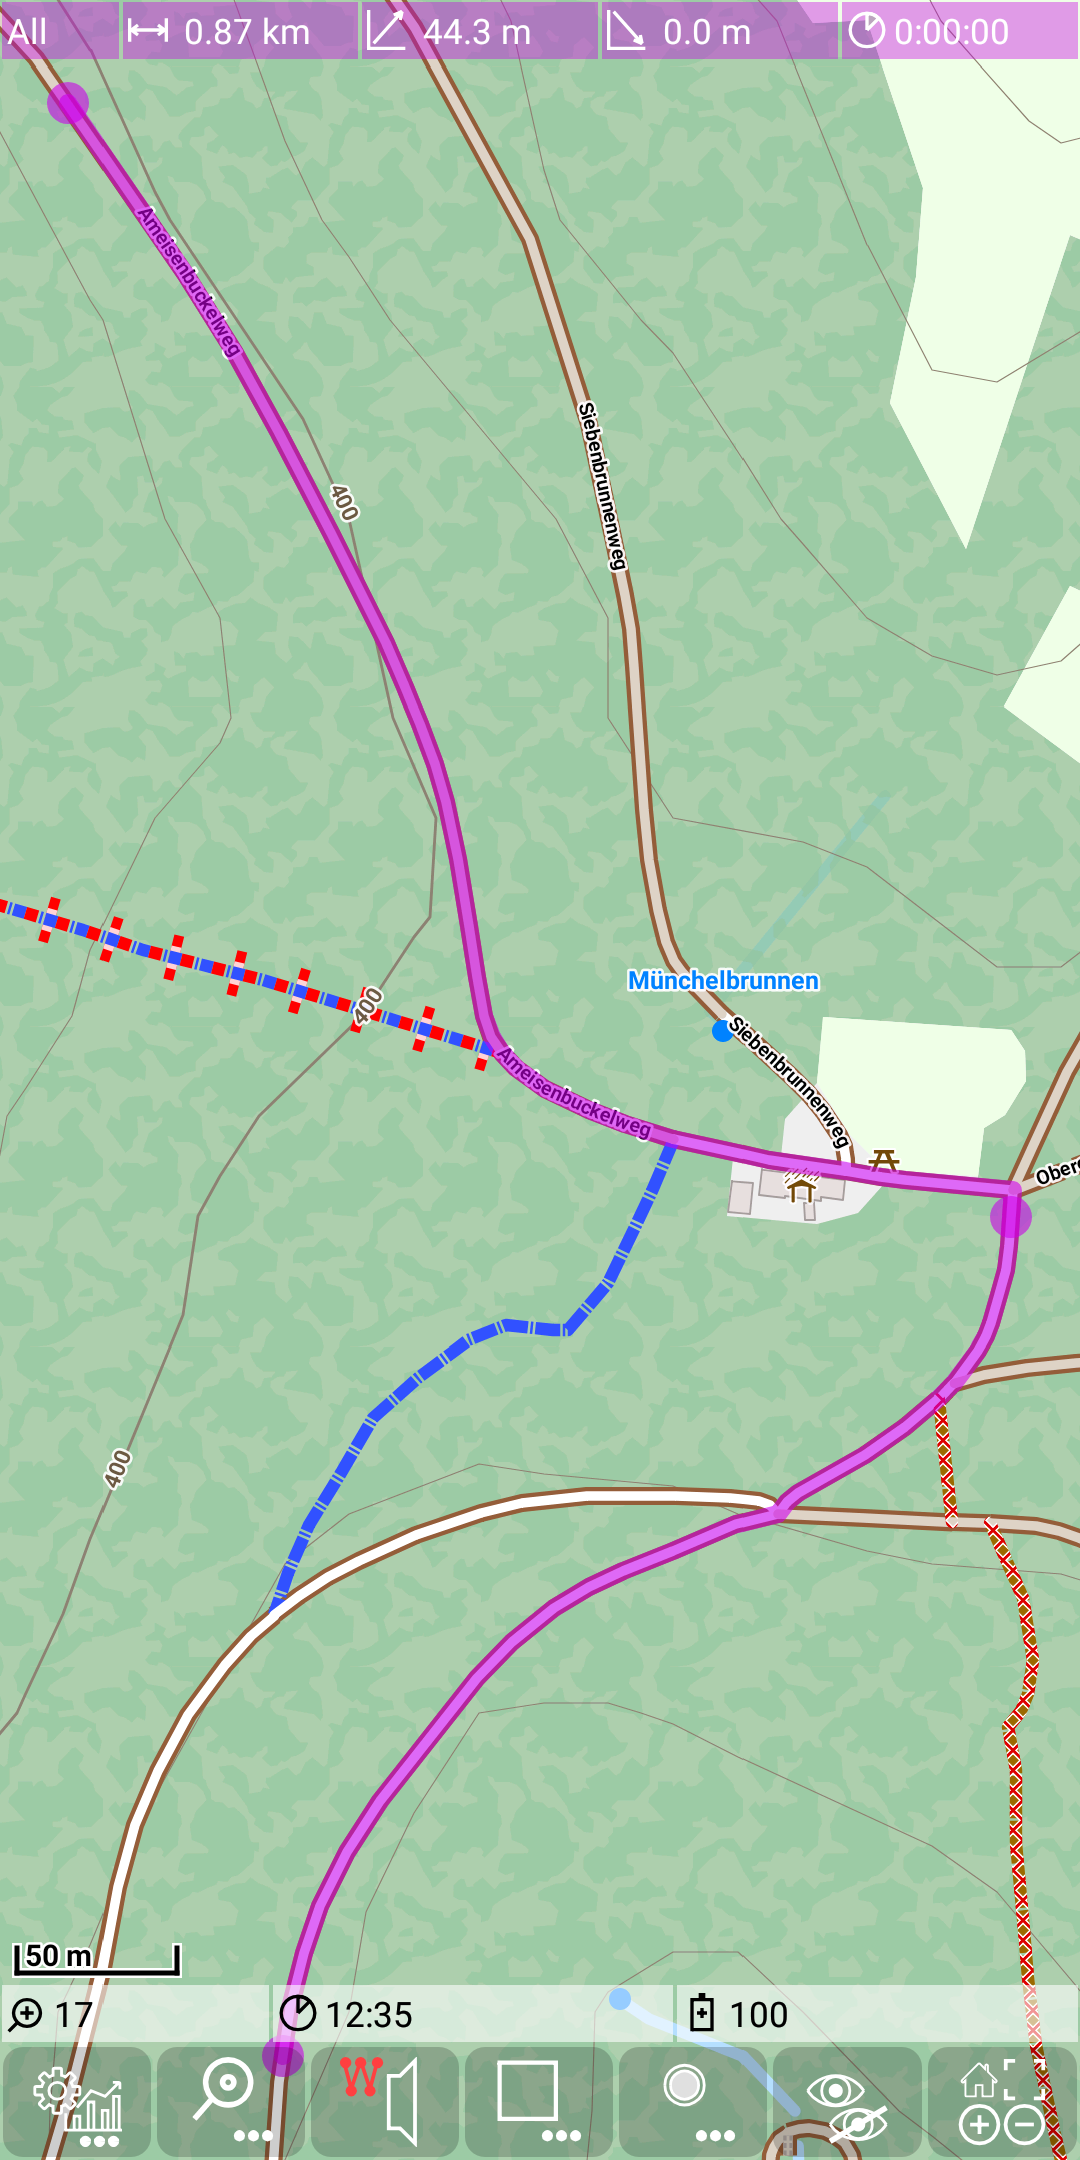
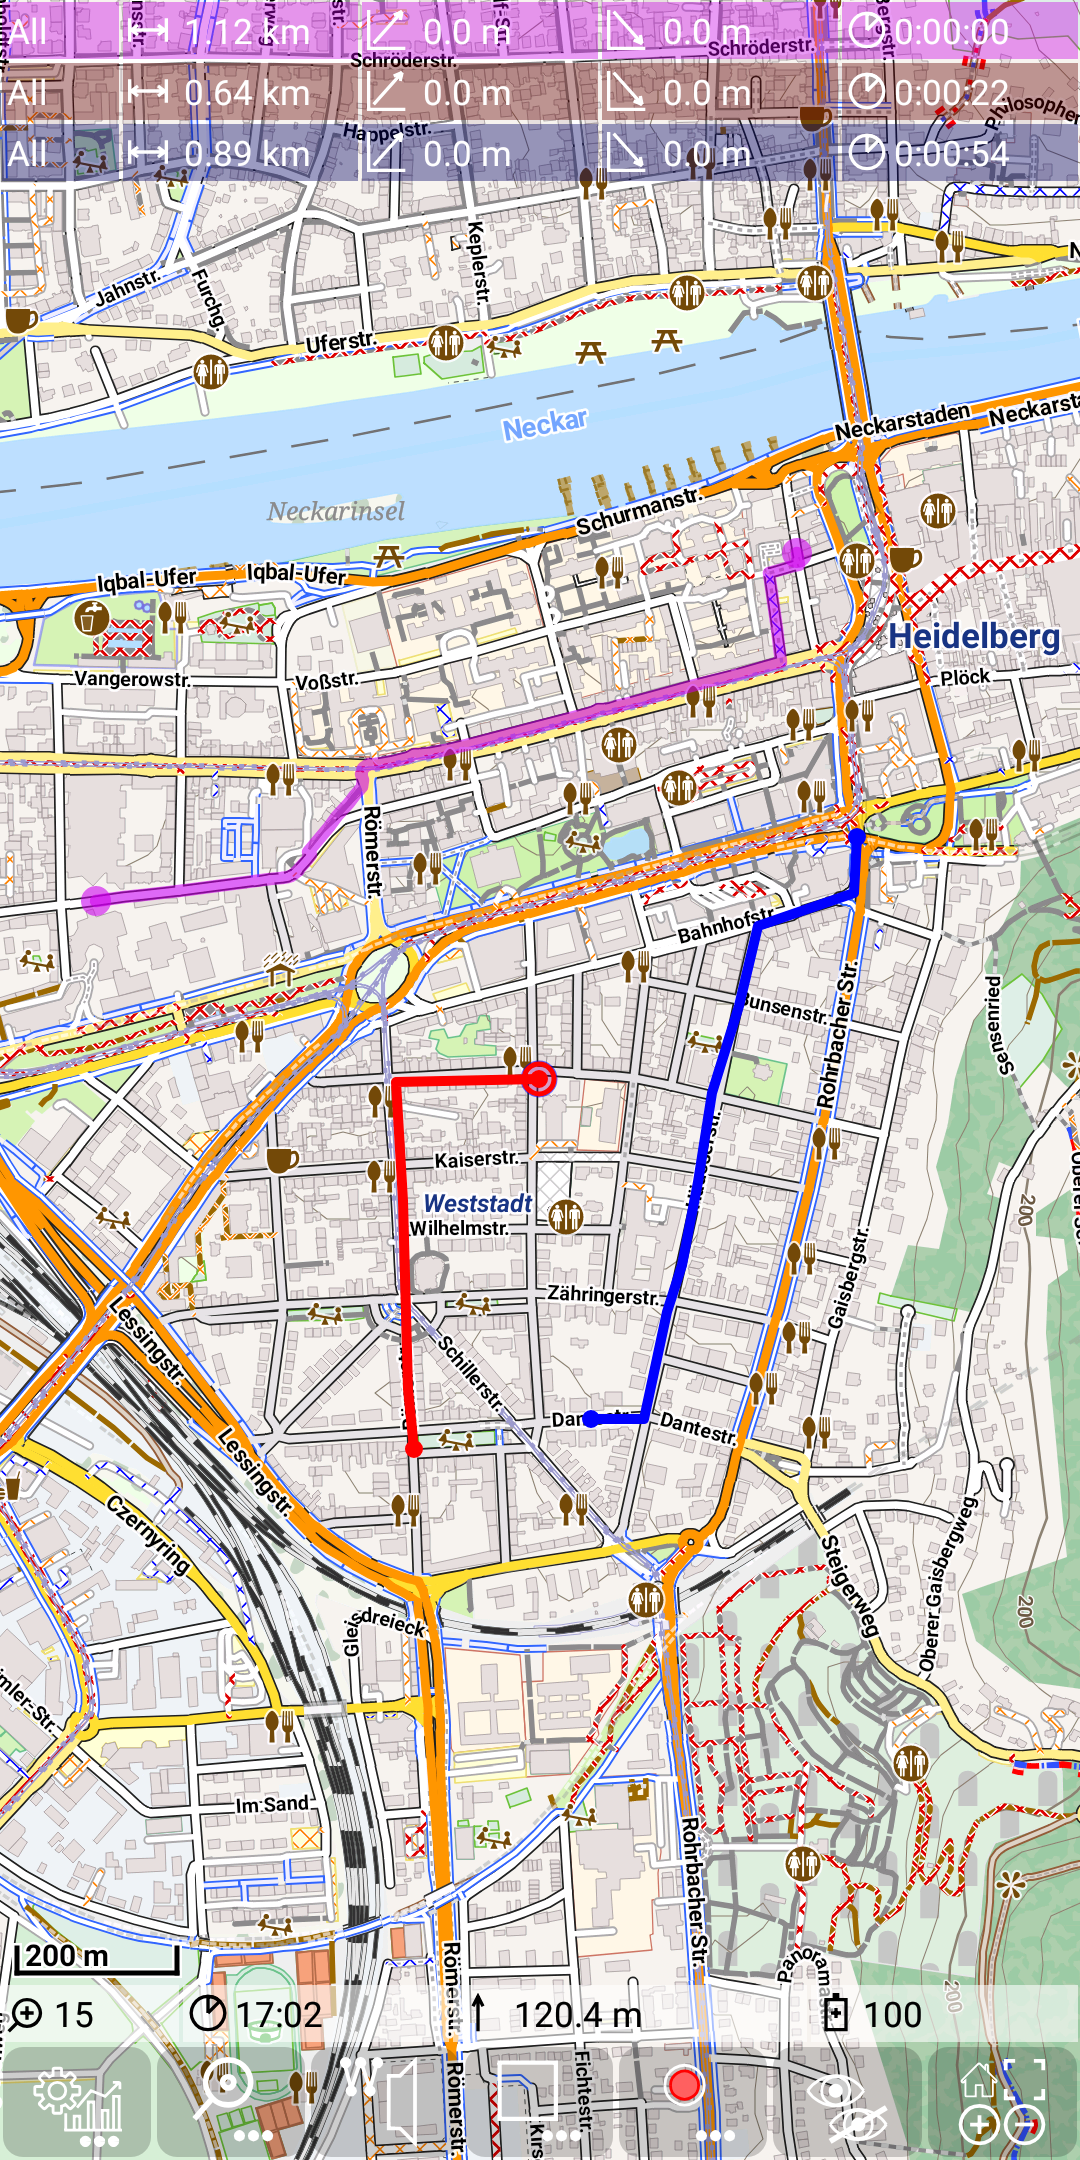
As we can see with the last example, multiple entries can exist at the same time, depending on whether there is currently a recording track, a selected track and/or a route track.
If a track has multiple segments, then may have two dashboard entries, one for the whole track and the second for one of the segments. For a recording track you always see the whole track statistic and the statistic of the current recording segment:
For a selected track the segment can be changed by tap on the desired segment. The next example illustrates a track with two segments:

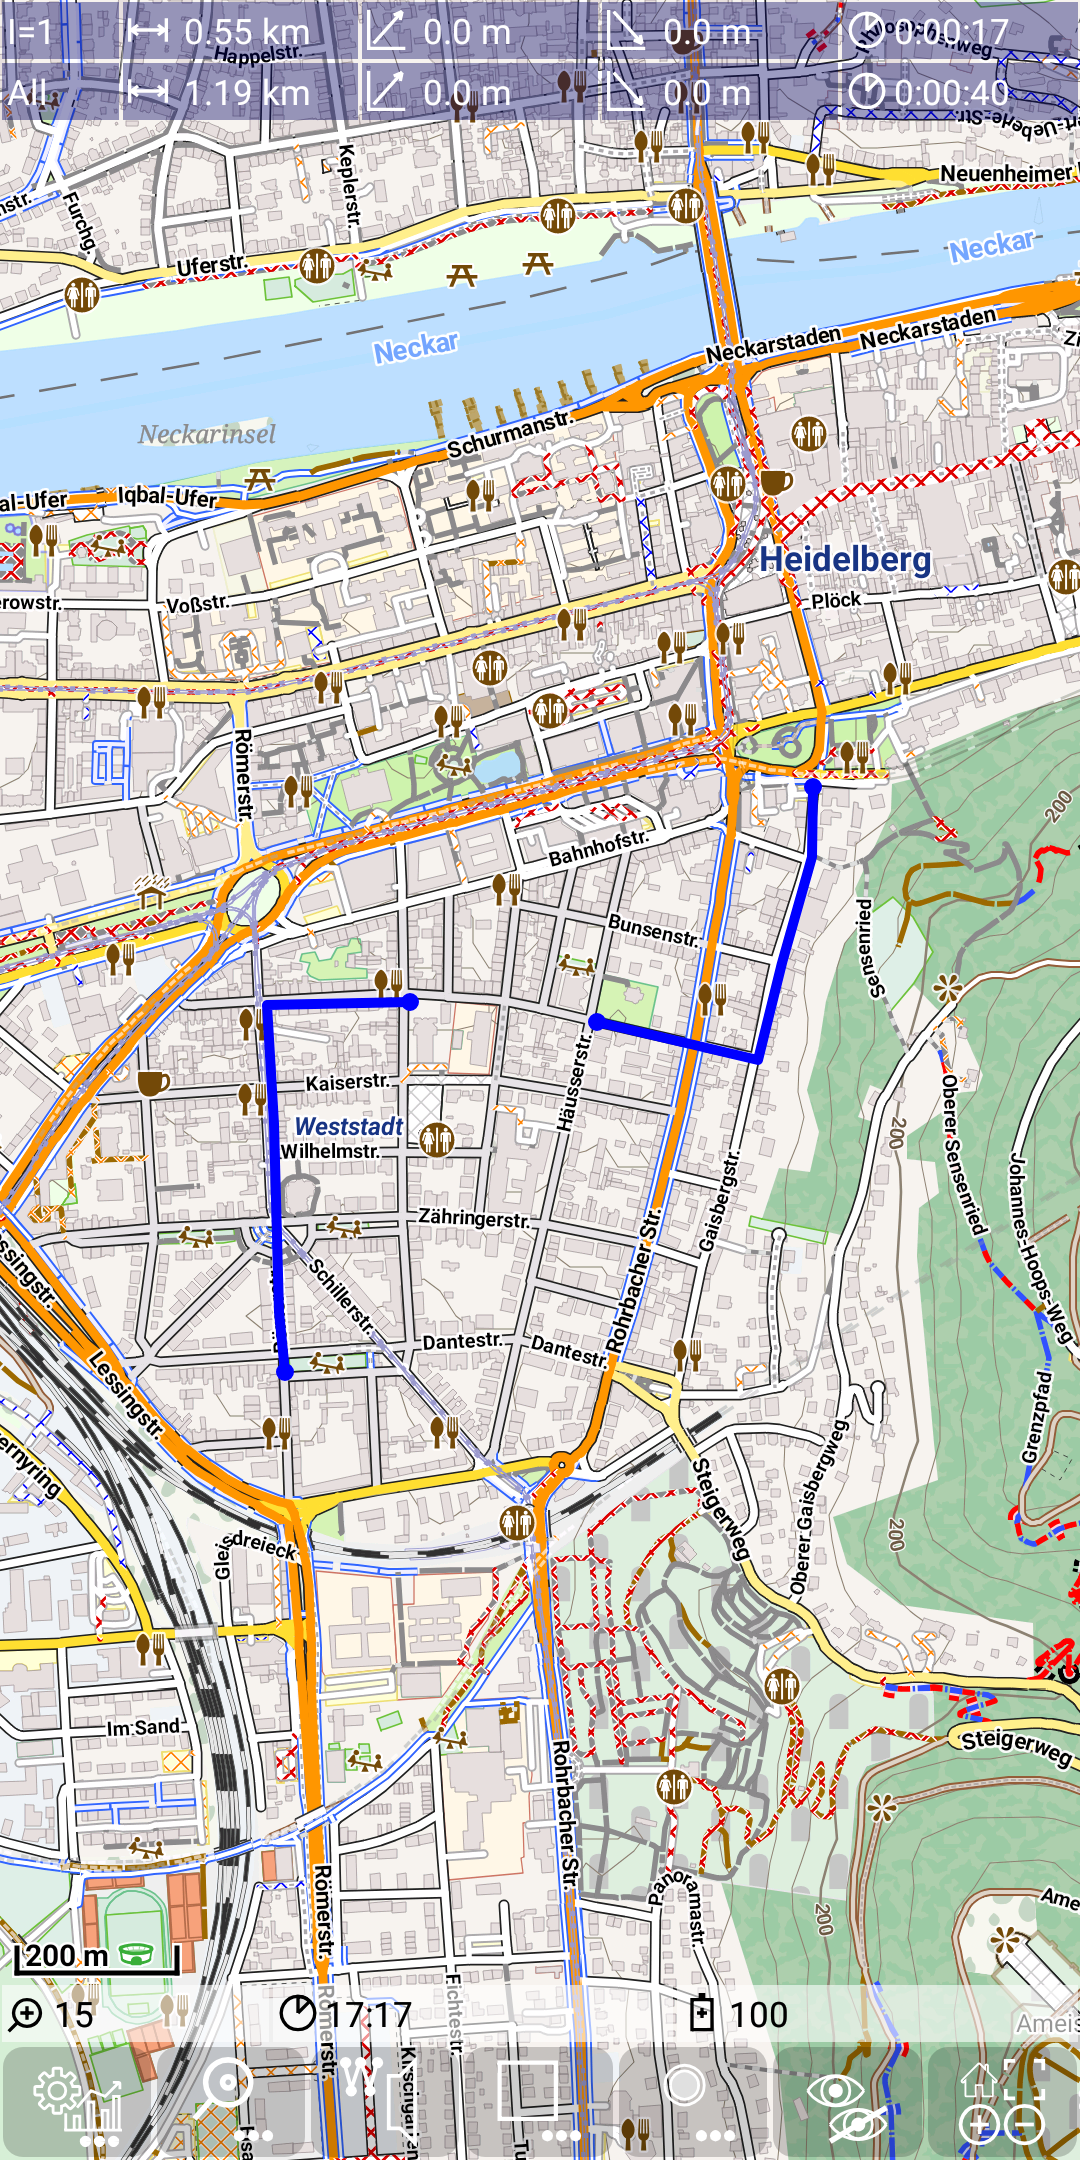
The total values of the track correspond to the sum of the segment values.